


Impact of trade war on Emerging Asia: no short-term winner but Vietnam, India and Thailand to gain in the medium
China is a global manufacturing powerhouse
When analyzing import tariffs that have been introduced so far, Chart 1shows that the US has targeted manufactured goods while China has mainly targeted primary goods (See Trump’s trade war knocking at 2018’s door). The tariffs reflect the asymmetrical trade relationship between the world’s two largest economies as well as China’s unwillingness to tax high-tech US goods as it still needs them.

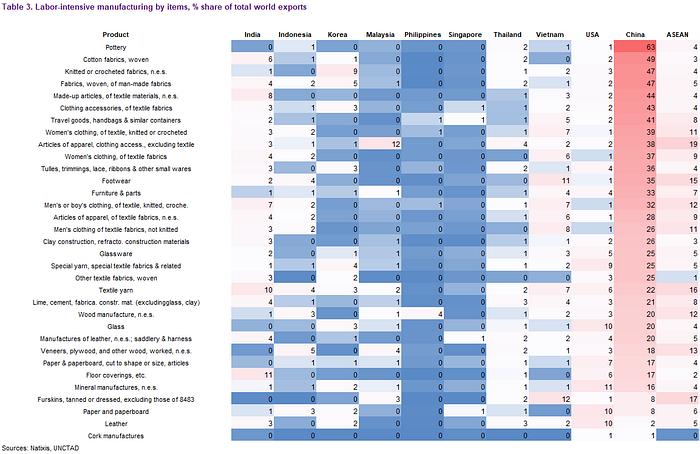
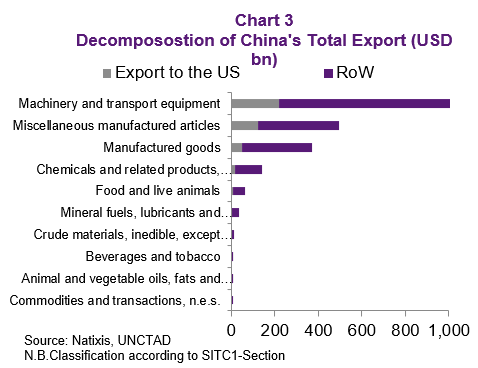
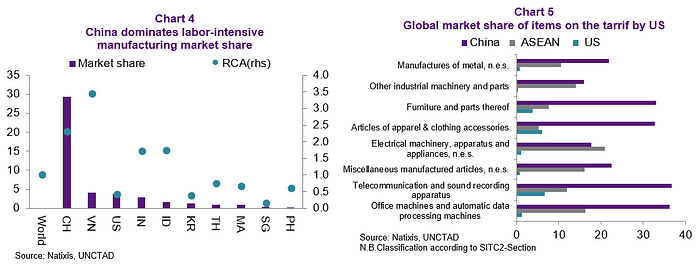
On the US side, targeting manufactured goods is a reflection of both China’s sizable surplus in this field and dependence on the US as a final consumer (Chart 3). In particular, Chart 4 shows China’s global market share in labor-intensive manufacturing and its revealed comparative advantage (RCA)[1]. Only Vietnam has a higher RCA in labor-intensive manufacturing although with a much smaller market share than China. When looking into different sectors, China’s global market share reaches 40% in the telecommunication sector as well as in office machinery and also very high for many others. Interestingly, ASEAN as a whole happens to be the second most important exporter of some of these manufactured products, so one would wonder whether the US-China trade war might create some opportunities for ASEAN economies to replace China in these goods.
More specifically, this note looks into two key questions: a) in the short-term, how much of Chinese-made manufacturing and American-made products can be substituted by regional counterparts such as ASEAN and India; and b) in the medium-term, who will gain most from higher costs of Chinese exports via relocation of the supply chain?
Substituting is hard in the short-term
The trade relationship between China and the US may be contentious at this moment but also reflects the two countries’ complementarity due to differences in labor costs and endowments. In fact, our analysis of RCA (Chart 4) clearly shows how China has such a massive global market share of labor-intensive goods. The US, Korea and Singapore are similar in that they have less than 1 RCA for labor-intensive manufactured goods, which means they are unlikely to be good substitutes for Chinese labor-intensive goods as well as destinations for arbitraging on the tariffs given high wage costs. Only Vietnam has a higher RCA than China in labor-intensive manufactured goods, though Indonesia and India are not too far behind. But because of China’s dominant position in the global production chain in the short-term and everyone’s small existing share, even Vietnam’s, much of China’s labor-intensive goods cannot easily be replaced.
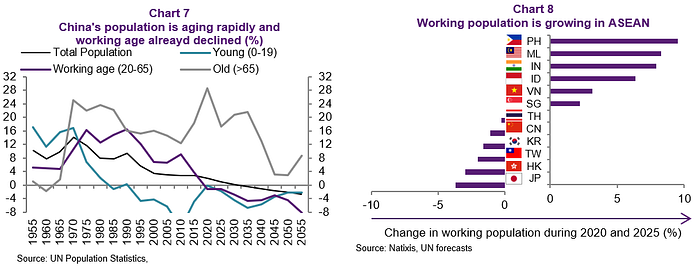
We also dig deeper into the top eight items of Chinese manufactured goods comparing China’s global market share per sector (Chart 5). For the top two sectors, China has greater than 35% market share and more than 20% for the rest, which seems difficult to challenge in the short run. ASEAN trails China except for electrical machinery where the ASEAN region comes first. When looking into whether ASEAN can increase its market share in these sectors as China faces US import tariffs, one would need to consider how high the price elasticity of consumers in the US is. If low, consumers will pay higher prices. Otherwise, they may be ready to consume goods produced elsewhere.
Beyond the relative acceptance of US consumers of higher prices, Chinese manufacturers can also react by cutting their margin or even can benefit from government actions such as export tax breaks, which have already been announced for as much as 16%.
When focusing on China’s import tariffs on US goods, the potential for ASEAN countries to reap benefits is even more limited. China’s tariffs mainly target commodities (soybean and oil) and, to a lesser extent, high-tech products that ASEAN economies hardly produce or for which they do not have any relative comparative advantage (low RCA). Chart 6 shows the large US market share in the top eight items on which China has imposed import tariffs. Although the share of cathode valves (semiconductor) looks small, it actually hides the US specialization in the highest end of this sector, which ASEAN economies cannot yet produce, let alone export.
Within this context, the short-term gain of trade-war for ASEAN might not be large as it is difficult for the region to substitute China as source of manufacturing products to the US nor the US exports into China. The former is due to China’s dominant manufacturing capacity and high revealed comparative advantage (RCA), and the latter is because of ASEAN’s low RCA for the sectors that China has imposed tariffs US goods.
But in the medium term, China’s increasing costs to push production towards ASEAN and India
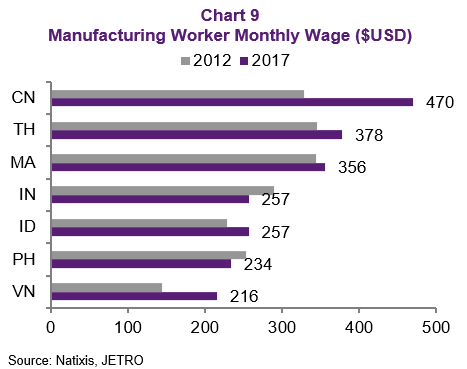
We now explore the medium-term implications of supply chain cost arbitrage, which we believe is larger than the substitution of goods related to increased tariffs stemming from ongoing trade war. There are many determinants of foreign direct investment (FDI) such as push (higher costs of production via either input costs or trade barriers, lower domestic return) and pull by host countries (cheaper input costs, infrastructure and institutions). In particular, ASEAN and India do have a cost advantage for some of the labor-intensive manufacturing currently produced in China, and China’s aging population will only push labor costs higher (Chart 7) due to declining working age population.
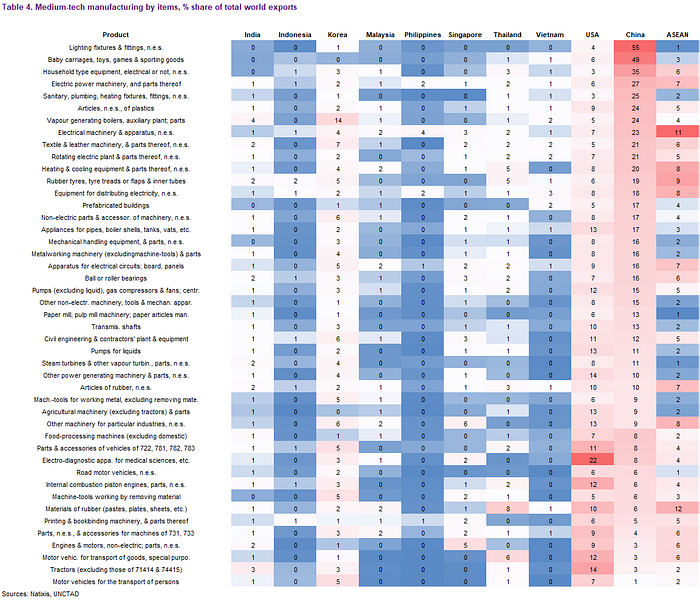
Many ASEAN countries (except Thailand) are in a much better position in terms of a growing working population with the Philippines topping the ranking (Chart 8). In addition, rising income means that China’s cheap labor comparative advantage will deteriorate. At the same juncture, the US non-existent labor-intensive comparative advantage means that it will unlikely to reshore labor-intensive manufacturing so the US will need to find other geographies for the sourcing of goods. In addition to labor-intensive manufacturing, we also look at medium-skill manufacturing areas that ASEAN can capture the arbitrage from China as these countries already have significant market share and infrastructure.
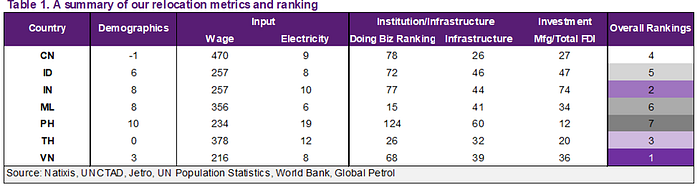
Beyond the demographic change, rising costs in China, particularly manufacturing wage costs, are growing much higher than the rest of ASEAN, which erodes its labor-intensive manufacturing competitiveness. Furthermore, even electricity costs are higher. For labor costs, the four countries again rank highest for cheapest, reflecting their labor advantage. But for inputs such as electricity, Vietnam clearly outperforms in affordability (Chart 9 and Table 1).
As stated earlier, determinants of FDI are other than demographic trends and input costs — intangibles, in terms of the ease of doing business, and quality of infrastructure are as equally important. Moreover, firms already vote with their feet, and we can also use the ratio of manufacturing as a share of total FDI as a gauge for investment factors not measured in our demographic, input costs (wage and electricity) and infrastructure (hard and soft) indicators.
Table 1 show the levels of our four key indicators: a) percentage working age population change from 2020 to 2025 for demographics; b) monthly wage costs in USD for manufacturing worker and electricity costs as measures of inputs; c) the World Bank’s Doing Business rankings for soft institution and the World Bank Logistics Index for hard infrastructure; and d) the share of manufacturing as a percentage of total FDI. To put all these determinants of FDI together, we normalized the data and summed the four criteria to get a score; for inputs, we take an average of wage and electricity; and for infrastructure, we take an average of Doing Business and logistics. From the summation of the four categories, we rank the countries and show our results in the last column, with 1 best and 7 worst.
For the first item, demographics (Table 1), the Philippines is clearly a winner in this for its robust population growth, although Malaysia, India, Indonesia, and Vietnam are also strong. For the intangible, Malaysia and Thailand are best for soft infrastructure as their Doing Business scores are much higher than the rest with the Philippines the lowest. Although the Philippines has amazing demographics, its business environment is the weakest in Asia. For hard infrastructure such as roads and ports — China is best while the Philippines, again is behind. In other words, it has people but not the hard and soft infrastructure to support manufacturing. In turn, while Thailand’s demographic is not positive, its infrastructure and business environment are best. The third factor is cost, either labor costs or electricity. Clearly, a labor-intensive firm would be very keen to invest in Vietnam and India given the low wage costs but the cost of electricity is relatively high in the India, when compared with Vietnam.

Beyond the demographics, soft and hard infrastructure and the input costs, we also look at how investors allocate their manufacturing into these countries as a share of total FDI. According to the latest investment review report by UNCTAD, China still absorbs the bulk of FDI into Asia but ASEAN, as a region, has exceeded China as an attractive investment destination (Chart 10). Although China is still attractive, it is increasingly less so for manufacturing, which declined from 62% of total FDI in 2006 to only 27% by 2017. Chart 11 shows FDI inflows into manufacturing as a share of total FDI. Manufacturing FDI into Vietnam, Indonesia, and India are already quite large as a share of total FDI received, and larger than for China (Chart 11). The Philippines is an outlier in that it has cheap costs of labor but still does not attract a large share of manufacturing FDI, likely due to relatively uncompetitive infrastructure and electricity costs.
Based on our four criteria, for the overall rankings, Vietnam tops the league table and India comes second. The bottom is the Philippines, which is not surprising given its unfavorable business environment and high input costs despite favorable demographics. In fact, the low share of manufacturing FDI as a share of total shows that the poor ranking for the Philippines is a consensus by investors in this sector. China still ranks 4 out of 7 as it performs very well on the hard infrastructure side and still has a relatively large share of manufacturing to total FDI.
Finally, we would like to compare the appeal of ASEAN countries to two types of manufacturing production, namely labor-intensive versus capital intensive. Our findings are in Table 2. For labor-intensive manufacturing, we focus on demographics and input costs. Vietnam is the best and India and Indonesia are second and third, respectively. This reflects both favorable demographic transition and cheap wages. The fact that China ends in the last spot for labor-intensive manufacturing indicates that the pressure to offshore away from China must be there already. Please see the Appendix for a table of labor-intensive manufacturing sectors that could be keen to relocate.
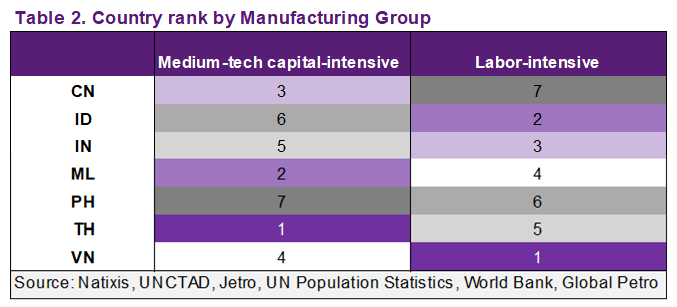
For medium-tech and capital-intensive manufacturing, we focus on intangibles such as soft and hard infrastructure and less on cost of inputs. In fact, the rankings come from the summation of Doing Business and Logistics scores on Table 1. Thailand this time comes first best for high-value added manufacturing despite its worsening demographic trends thanks to the best in class general business environment and infrastructure. Malaysia and China are also both strong while Vietnam drops to fourth place. The Philippines remains last.
All in all, China’s massive stake in global manufacturing makes it very difficult for emerging Asian economies to gain in the short-run by exporting goods to the US for the sectors with import tariffs for China. This is even less the case when trying to substitute US exports into China for those sectors China has targeted since they do not have the comparative advantage to produce such goods.
Such a pessimistic message as regards emerging Asia’s potential gains from US-China trade war needs to be balanced by a much more optimistic medium term. The reason is China’s ever increasing costs for manufacturing. After analyzing the key factors behind manufacturing capacity for labor-intensive and capital-intensive goods (namely demographics and input costs for the former and soft and hard infrastructure), we conclude that Vietnam is best place to take a share of China’s labor-intensive manufacturing, followed by India, and Thailand is best placed to specialize in capital-intensive manufacturing, followed by Malaysia.
Note:
[1] That is, the RCA is equal to the proportion of the country’s exports that are of the class under consideration divided by the proportion of world exports that are of that class.
Appendix: